

You're diligently creating short links with To Your Link and watching the clicks come in – that's a great measure of initial engagement. But the true power of your links unfolds when you look beyond the total click count and delve into the rich tapestry of data our analytics dashboard provides. Powered by a sophisticated analytics engine, To Your Link offers a wealth of information about who is clicking, where they're coming from, how they're accessing your links, and whichchannels are driving them. Understanding these details can revolutionize your marketing strategy.
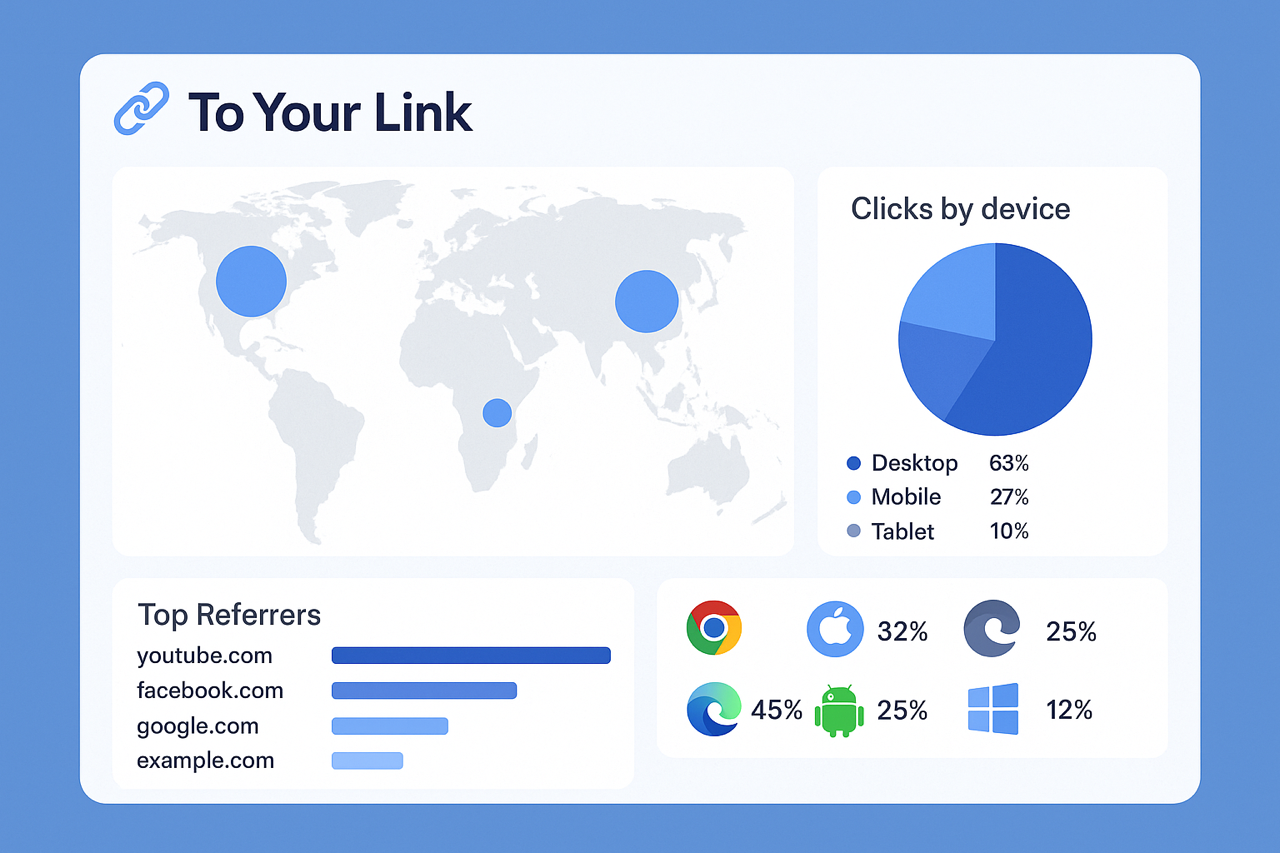
Let's start with understanding your audience's "where" and "how." The To Your Link analytics dashboard provides detailed geographic data, often breaking down clicks by country and even city. Are you seeing unexpected interest from a new region? This could signal an untapped market or a need for localized content. Alongside location, you can typically see which devices (desktop, mobile, tablet), operating systems (Windows, macOS, Android, iOS), and browsers (Chrome, Safari, Firefox) your audience uses to access your links. If a vast majority of your clicks are mobile, for instance, it underscores the critical importance of mobile-first design for all your destination pages.
Next, tracing the path of your visitors through referrer data is crucial. To Your Link helps you identify exactly which websites, social media platforms, or other online sources are sending traffic to your short links. Is that guest post you wrote driving significant clicks? Is your Twitter campaign outperforming your LinkedIn efforts for a particular link? This information is invaluable for pinpointing your most effective promotional channels, discovering potential partnership opportunities, and understanding where your content truly resonates. It allows you to focus your efforts and budget where they’ll yield the best results.
Ultimately, the comprehensive analytics suite within To Your Link is designed to transform raw data into actionable decisions. Knowing that a specific city shows high engagement might prompt a targeted ad campaign for that area. Realizing most users access a link via Android devices on Chrome could guide your testing priorities. Seeing a particular blog consistently referring high-quality traffic might inspire more content collaborations. By regularly exploring your full analytics dashboard – from real-time click monitoring to these deeper demographic and referral insights – you move from simply sharing links to strategically optimizing every click for maximum impact.
Ready to truly understand the story behind your link engagement?
Dive into your To Your Link analytics dashboard today. Go beyond the click count and explore the geographic, device, browser, OS, and referrer data to uncover powerful insights that can sharpen your marketing and content strategies.